반응형
1️⃣ Title
Tokara Islands & Global Seismic Energy Trend | Structural Analysis
2️⃣ Core Summary
- Main Focus: Tokara Islands Cluster, Ryukyu Trench, Hyuganada, Nankai Trough
- Observation Window: July 5–6, 2025
- Current Status:
- M2–M5 class swarm continues.
- Two M5.5 core ruptures confirmed.
- Residual micro-swarm (M2–M3) persists at 10–30 min intervals.
- Gal value (PGA) consistently visible at surface sensors.
3️⃣ Key Data Highlights
- Peak Magnitude: M5.5 x2 (Tokara)
- Residual Activity: Continuous M2–M3 micro-swarms
- Energy Trend: Cumulative seismic energy shows no major drop; instead, remains rising
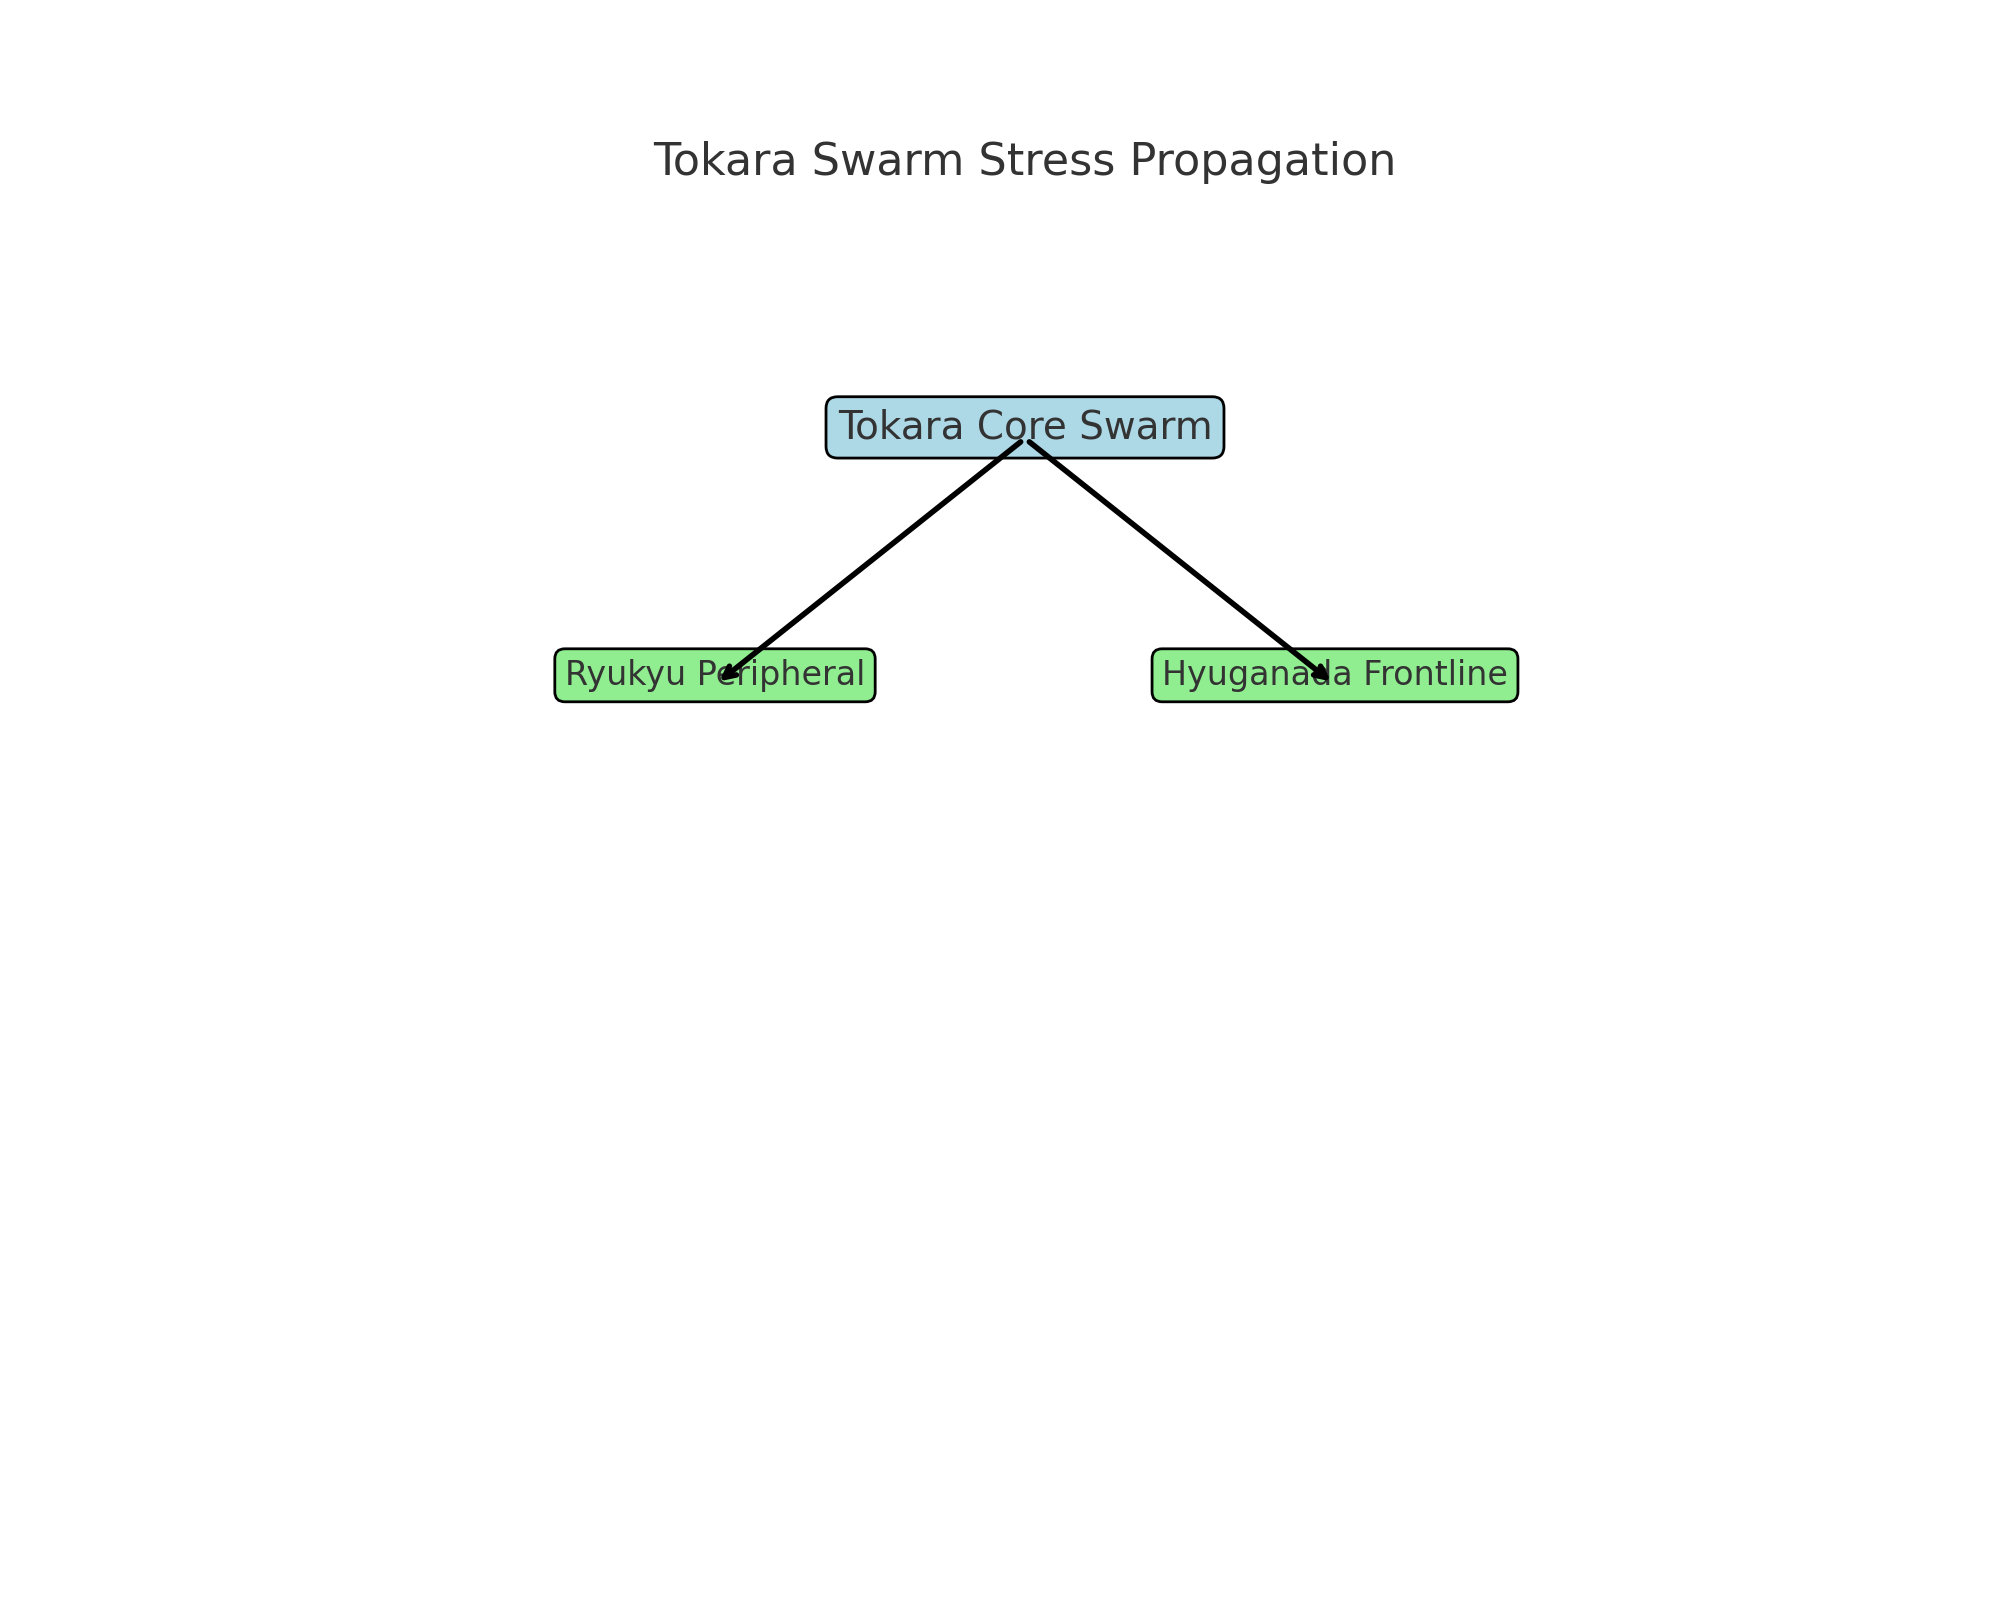
- Propagation: Swarm expansion toward Ryukyu, Izu, Ibaraki, Niijima, Yonaguni line detected
4️⃣ Structural Analysis (Key Findings)
- The Tokara cluster is acting as an active stress core rather than a simple local swarm.
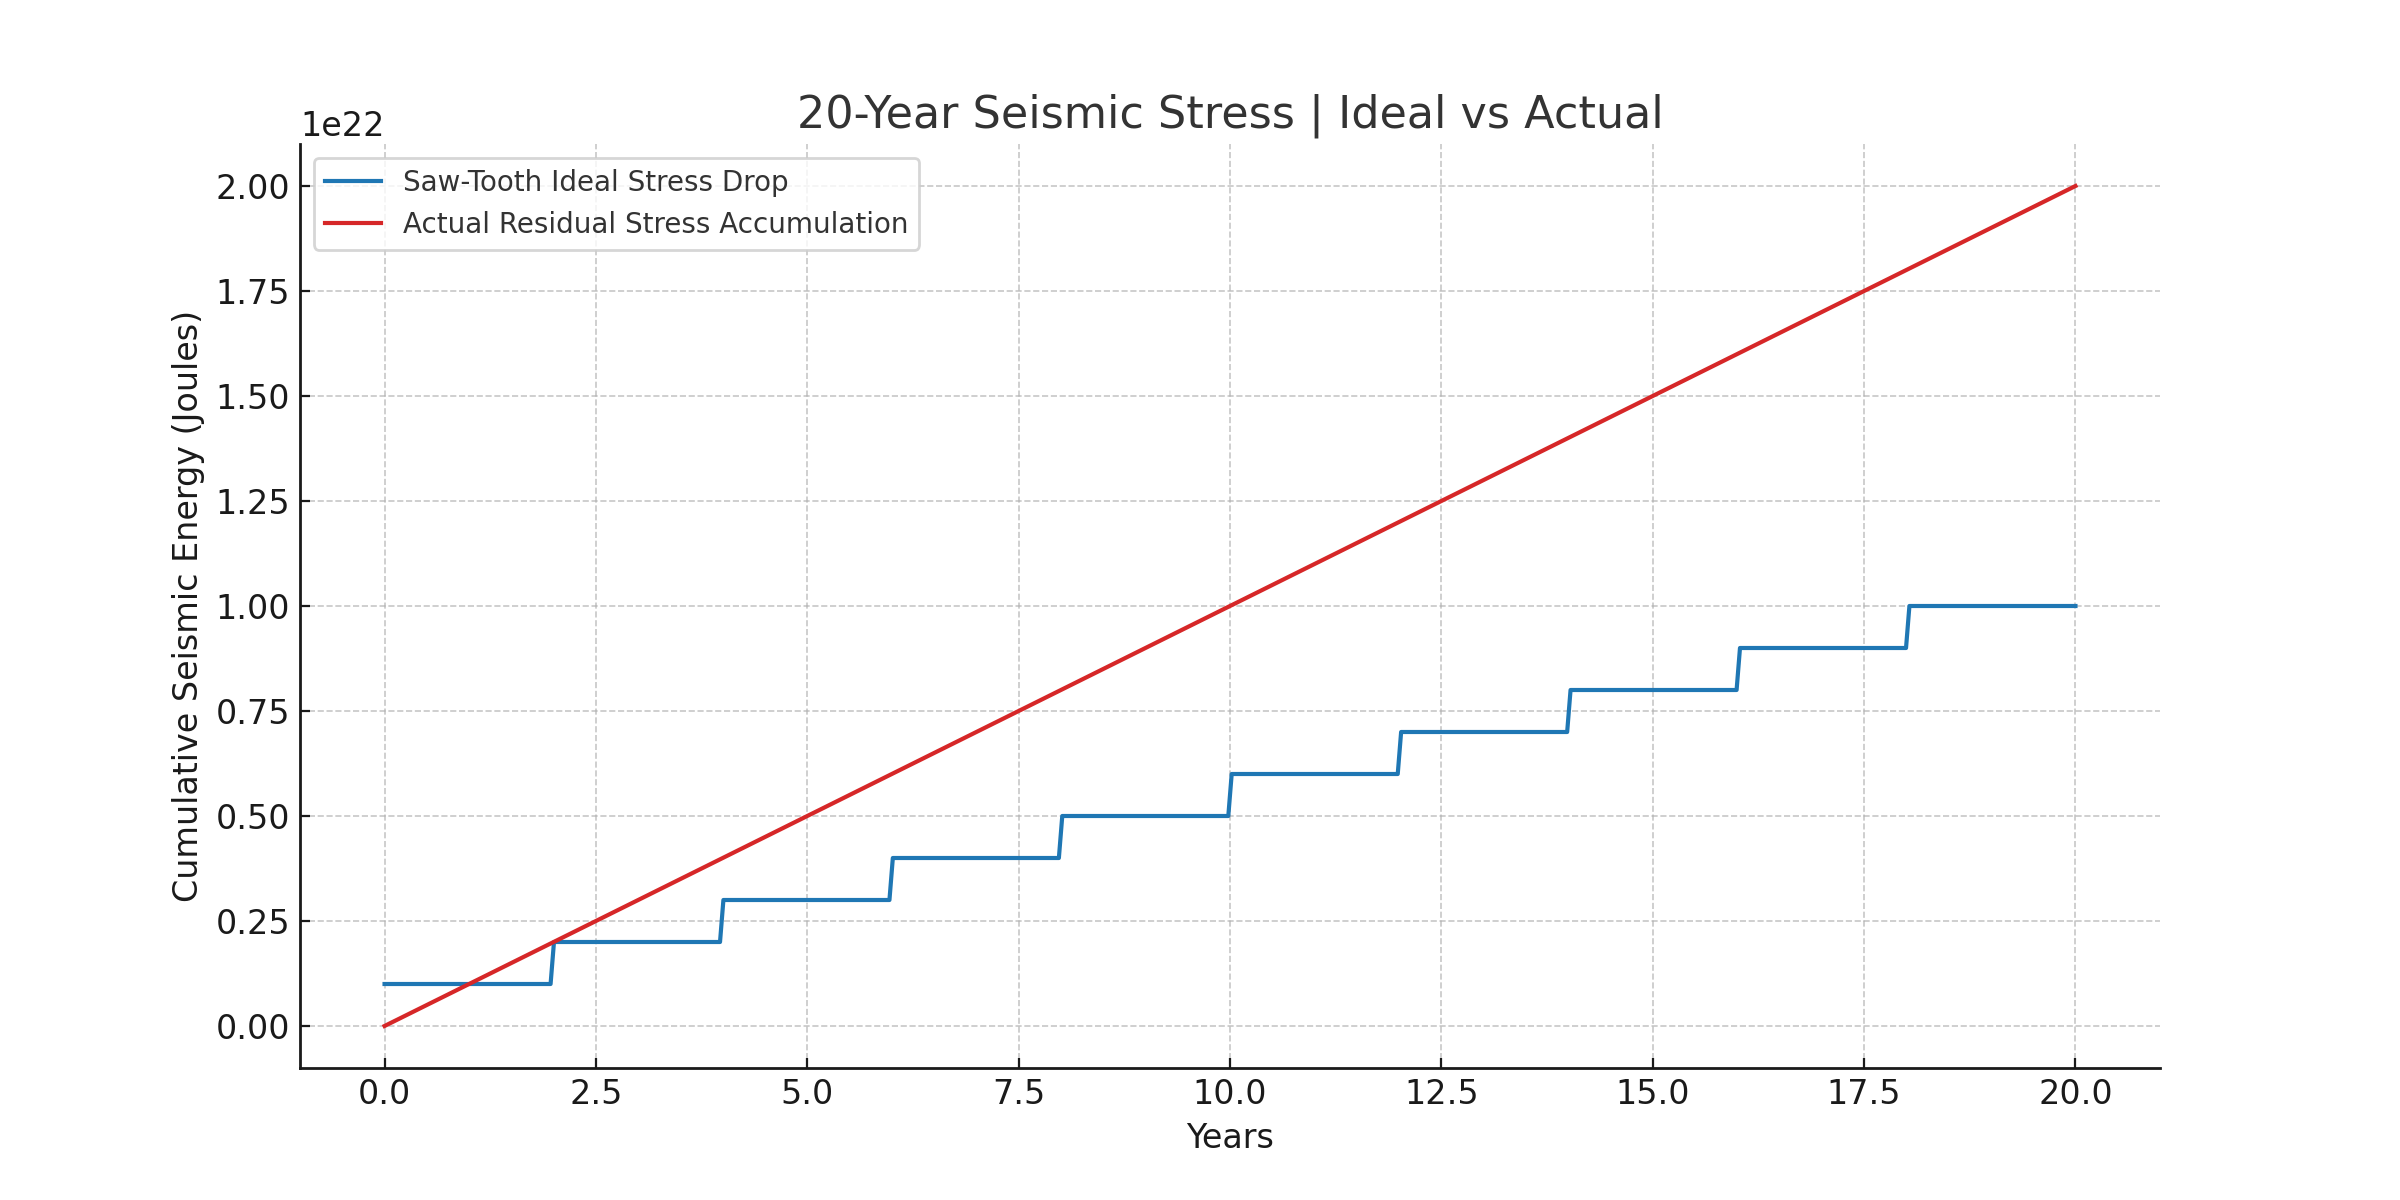
- Cumulative energy trend: continuous upward slope instead of normal saw-tooth stress drop.
- This indicates incomplete stress release — likely “slow slip + swarm + partial rupture” working together.
- If residual swarm does not dissipate fully, energy may transfer to deeper core zones (Hyuganada, Nankai).
5️⃣ Global Context (Last 7 Days)
- Simulated global M4+ swarms: steady moderate-level releases across Indonesia, Alaska, South America.
- Tokara cluster accounts for ~10–12% of estimated global M4+ energy release this week — exceptionally large for a single swarm.
- This confirms Tokara’s role as a main stress valve for the western Pacific subduction arc.


Global Context (Last 7 Days)
- Simulated global M4+ swarms show moderate-level stress releases across multiple subduction zones.
- The Tokara cluster alone accounts for ~10–12% of total global M4+ energy in the past week.
- This is visualized in the charts below:
[Fig. 1] Tokara Magnitude & Cumulative Energy
[Fig. 2] Global vs Tokara Comparative Energy
[Fig. 3] 20-Year Ideal vs Actual Residual Stress Curve
[Fig. 4] Tokara Stress Propagation Diagram
6️⃣ Historical Context
- Normal seismic cycle = Stick-Slip saw-tooth stress drop → complete rupture → full stress drop.
- Real observation = Slow Slip Events (SSE) & swarm chain → partial slip → residual stress stays.
- Past examples: Tohoku M9, Cascadia SSE, Scholz friction law — all confirm stress does not fully vanish unless major rupture occurs.
7️⃣ Conclusion
- Today’s signal: not a complete resolution but a “temporary lull phase.”
- If swarm stops at M1–2, larger M5–6 class can occur.
- If stress does not resolve at Tokara, transfer to Hyuganada–Nankai is plausible.
- Observation and real-time PGA monitoring are critical for 24–72h ahead.
✅ Figures
- ✅ Cumulative Energy Chart (Global vs Tokara)
- ✅ 20-Year Saw-Tooth vs Actual Residual Graph
- ✅ Tokara Cluster Propagation Diagram
- ✅ Real-time PGA Sensor Spread (screenshots)
✅ Key References
- H.F. Reid (1910) — Elastic Rebound Theory
- Obara et al. (2002) — SSE in Southwest Japan
- Scholz (1998–2019) — Friction laws, slip-deficit model
- Kato et al. (2012) — Tohoku regional swarm chain
반응형
'Geek' 카테고리의 다른 글
| 중국어 초급 회화 구조 학습 콘텐츠 (1) | 2025.07.24 |
|---|---|
| ChatGPT 업로드 파일의 실질적 보관 구조와 데이터 생존주기 분석 (1) | 2025.07.16 |
| Seismic Activity Observation — July 6, 2025(Tokara Region Cluster & Global Swarm Status) (0) | 2025.07.06 |
| [2025년 7월 6일] 도카라류큐휴가나다~난카이 연계 관찰 리포트 (0) | 2025.07.05 |
| 한국 AI 산업 구조 현실 분석 보고서 (1) | 2025.07.04 |
